01
Bird's Eye View
House readings, flock performance, stock position and orders in progress, on one screen.
Bird numbers move into production. Production into inventory. Inventory into orders. Orders into dispatch and into the accounts. You don't have to run all fourteen — modules are enabled per organisation, so a single-pen farm sees a handful and a full processing and distribution business sees the lot.
HOVER A STAGE TO SEE THE MODULES IT TOUCHES
House readings, flock performance, stock position and orders in progress, on one screen.
Organised operational reports and a guided builder for your own private reports, charts and CSV exports.
Explore reports →Groups, presence and reactions, plus alerts by in-app, email and WhatsApp.
Placement to depletion — batches, daily records, bird health, feed and water, environment and equipment.
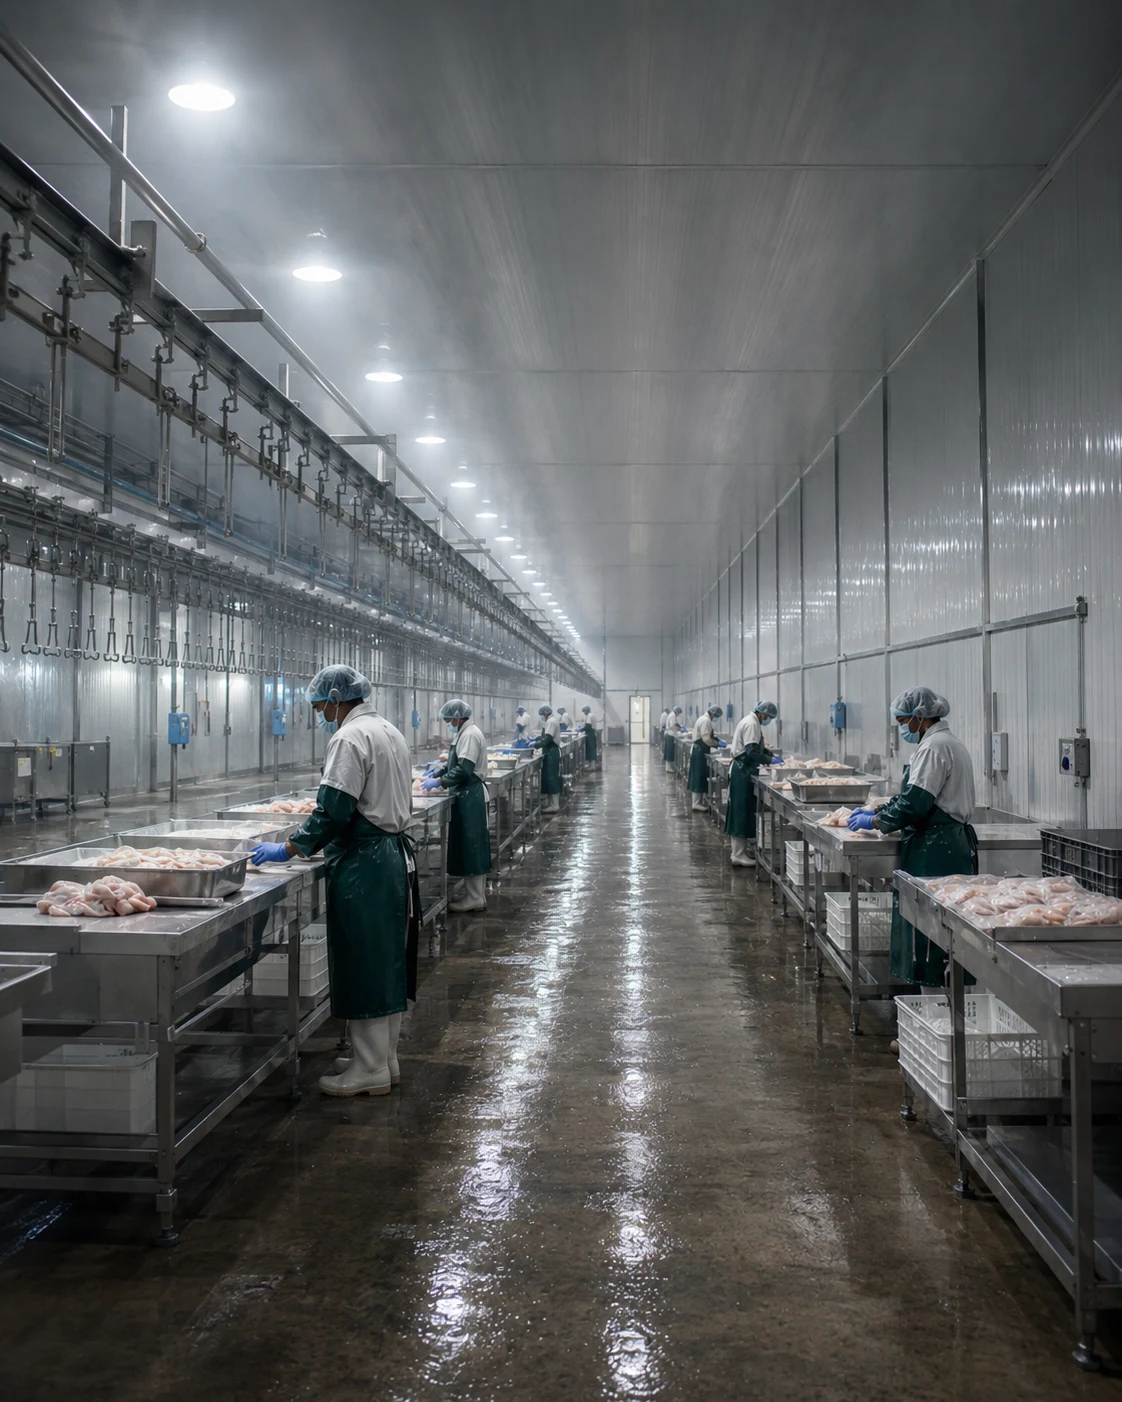
Processing runs, cold storage, product catalogue and bundles, with HACCP logs and CCP monitoring.
Forward planning across placements, processing and demand, with alerts on what needs action.
Sensor readings from houses and cold rooms, recorded and retained rather than shown once.
Stock, products, movements, valuation and cold storage — at lot level, with picks recommended by earliest expiry, then oldest production.
Orders, dispatch, invoicing and credit notes, with VAT on inclusive pricing and approval workflows.
Built-in counter sales from depot stock, with receipts, split payments, discounts and till reconciliation.
Forward and backward trace by lot, QR generation and camera scanning, recall scoping.
Suppliers, purchase orders and goods received — including deliveries above the ordered quantity, with accepted quantities added to stock and excess recorded.
Vehicles, drivers and routes, with live GPS positions, fill-to-fill fuel economy and compliance dates.
Requests, scheduled work, downtime and job costs against equipment, vehicles and farm infrastructure.
Plus Settings — organisation setup, users and roles, module enabling and renaming, branding, invoice configuration, security policy, QuickBooks connection and the audit trail — and the in-app Manual, with a separate administrator edition. Both ship on every deployment.
Feed, chicks, packaging and consumables are ordered and received against suppliers, then carried into the stock they become — so a cost increase on the inbound side shows up where it lands.
Grower feed, 20t · due 08 Aug
Day-olds, 24,000 · due 14 Aug
Cartons, 6,000 · due 16 Aug
Vaccines · due 19 Aug
HACCP logs, CCP monitoring and biosecurity checks are captured where the work happens, timestamped against the person who entered them, and held permanently.
| Time | °C | Verified | Result |
|---|---|---|---|
| 08:00 | 2.1 | A. Marshall | In spec |
| 10:00 | 2.6 | A. Marshall | In spec |
| 12:00 | 4.3 | A. Marshall | Deviation |
| 14:00 | 2.8 | R. Best | In spec |
Poultry Plant › HACCP — CCP readings with the corrective action recorded against a deviation.
| Vehicle | Driver | Route | km/L | Compliance |
|---|---|---|---|---|
| TRK-02 | D. Alleyne | Route 1 | 6.8 | Current |
| TRK-04 | K. Springer | Route 2 | 5.9 | Insurance 14d |
| TRK-05 | M. Griffith | Route 4 | 7.1 | Current |
Fleet — live positions from GPS telematics, with fill-to-fill fuel economy and compliance status.
Dispatch is planned alongside the orders it serves, and vehicle tracking connects your existing GPS telematics to the run.
A question about an order gets asked where the order is. Alerts reach people the way they actually read them — in the app, by email, or on WhatsApp for staff who are nowhere near a screen.
Requests from the floor become scheduled jobs with costs against the asset and against a budget, so the case for replacing a machine is made with its own record.
| Job | Asset | Est. cost | Status |
|---|---|---|---|
| WR-2211 | Chiller 2 | $1,250 | Overdue |
| WR-2209 | TRK-04 — brakes | $680 | Scheduled |
| WR-2204 | House 3 fans | $340 | In progress |
| WR-2198 | Scale calibration | $210 | Complete |
Maintenance — work requests with reporter, estimated cost and budget position.
Bring us the part of the operation that hurts most and we'll show you that module first.
Operational images are illustrative. Product previews use sample records.
Serve walk-in customers using the same product and depot stock records as the wider operation. Counter sales have their own receipts and till history, separate from wholesale orders.
Search or scan products, enter weighed quantities, or sell packaged products by the bag. Stock availability is checked before completing the sale.
Record cash, card or split payments, apply permitted discounts and show included VAT on receipts. Card payment recording does not imply an integrated card terminal.
Open with a counted float, track takings, and close against counted cash. Review variances and Z-read reports; permitted voids retain a reversal record and reason.
One module, organised into Farm, Supply Chain, Sales, Operations and My Reports. Choose a report within each area without working through a crowded dashboard.
See placement outlook and bird ages, review recorded feed, water and mortality, and compare flocks at the same age. Missing daily records are flagged so gaps are visible.
Review input replenishment, feed held in silos, supplier delivery performance and stock expiry risk. Forecast accuracy compares completed forecast periods with actual delivered demand.
Review customer buying patterns, Point of Sale activity and revenue with estimated product margins. Cost and tax gaps are identified; estimated margins are not a full accounting profit figure.
Review production input and output, equipment downtime and record completeness. Production weight differences include normal processing removal and are not automatically classified as avoidable waste.
Saved reports run against current records. Available data and financial measures follow your organisation's enabled modules and your access permissions.
Reports make recorded information easier to review. They do not fill missing records or promise a measured saving. Availability depends on your installed release and configuration.
Ask for an Analytics walkthrough →